Imagine if you could take a company’s financial pulse with a single number. If the number is high, the company is healthy. If it’s low, the company might be heading for the ICU (bankruptcy).
That is exactly what the Altman Z-Score does.
In the world of Financial Risk Management, this is one of the oldest and most famous tools for predicting corporate distress. Whether you are a Data Engineer building a risk pipeline or an investor looking at stocks, understanding this score is a fundamental skill.
What is the Altman Z-Score?
Developed by NYU Professor Edward Altman in 1968, the Z-Score is a formula that combines five different financial ratios to predict the probability that a company will go bankrupt within the next two years.
Before Altman, analysts looked at ratios individually (“Oh, their debt is high” or “Their profits are low”). Altman used statistical techniques (Discriminant Analysis) to prove that looking at these ratios together is far more powerful than looking at them alone.
The Formula (For Public Manufacturing Companies)
The classic formula looks like this:
$$Z = 1.2X_1 + 1.4X_2 + 3.3X_3 + 0.6X_4 + 1.0X_5$$Don’t let the math scare you. Here is what those $X$ variables actually mean in plain English:
- $X_1$ (Liquidity): Working Capital / Total Assets.
- Can the company pay its short-term bills?
- $X_2$ (Leverage/Profit Accumulation): Retained Earnings / Total Assets.
- How much profit has the company saved up over its lifetime? Young or struggling companies usually score low here.
- $X_3$ (Profitability): EBIT / Total Assets.
- How efficient is the company at generating earnings from its assets? (This is often considered the most important variable).
- $X_4$ (Solvency): Market Value of Equity / Total Liabilities.
- How much can the company’s value drop before it owes more than it is worth?
- $X_5$ (Activity): Sales / Total Assets.
- How well does the company use its assets to generate sales?
How to Read the Score
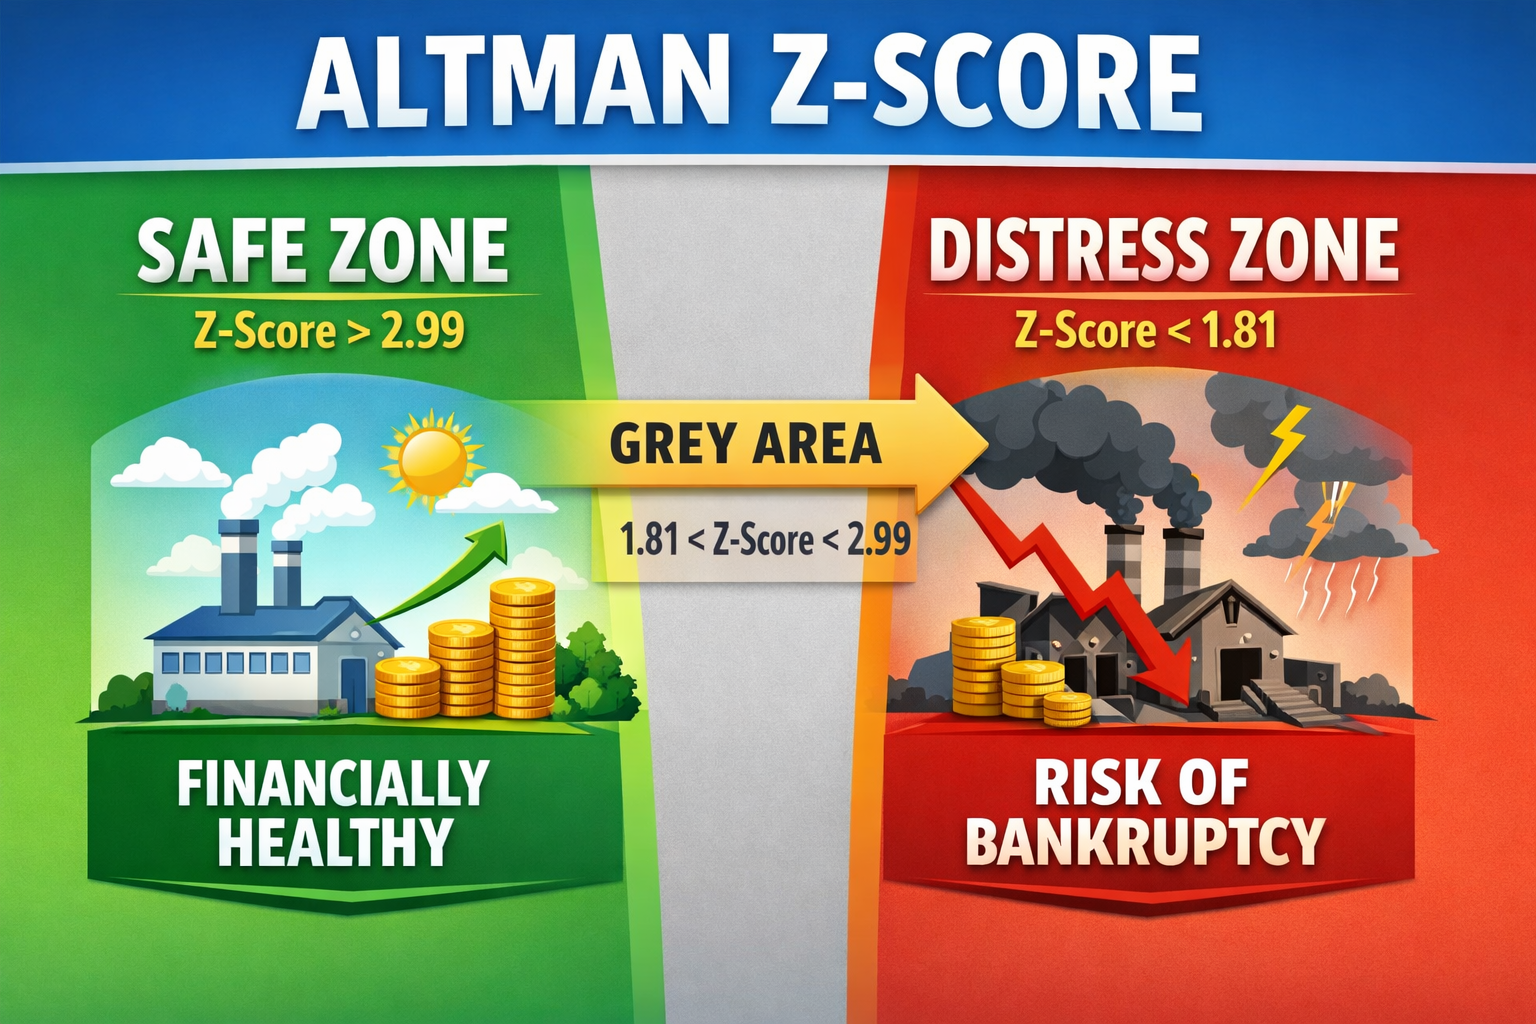
Once you plug in the numbers, you get a single Z-Score. You interpret it using a “Traffic Light” system:

- Green Zone (Z > 2.99): Safe. The company is financially sound and unlikely to fail.
- Grey Zone (1.81 < Z < 2.99): Caution. The company is not failing yet, but it’s not perfectly healthy either. It requires monitoring.
- Red Zone (Z < 1.81): Distress. There is a high probability of bankruptcy in the near future.
It’s Not One Size Fits All (Variations)
The original 1968 formula was specifically for publicly traded manufacturing companies. If you try to use it on a private tech startup or a service company, it won’t work well.
Professor Altman later released variations for these scenarios:
1. The Z’-Score (For Private Firms)
Private companies don’t have a “Market Value” (stock price). The Z’-Score replaces Market Value with “Book Value” of equity and changes the weights (coefficients).
2. The Z’’-Score (For Non-Manufacturing & Emerging Markets)
Service companies (like IT firms or Consultancies) don’t rely heavily on physical assets to generate sales. The Z’’-Score removes the $X_5$ (Asset Turnover) variable entirely to make it fair for non-manufacturing sectors.
Practical Applications
Who actually uses this today?
- Banks & Lenders: To decide whether to approve a loan. If a borrower drops into the “Red Zone,” the bank might cut off their credit line.
- Investment Managers: To filter out risky stocks. Many “Quality” investment strategies automatically sell any stock with a Z-Score below 1.8.
- Supply Chain Managers: To check if a critical vendor is about to go bust. You don’t want your main raw material supplier to file for bankruptcy overnight!
- Auditors: To assess if a company is a “Going Concern” (i.e., will it stay in business?).
Summary
The Altman Z-Score isn’t a crystal ball—it can’t predict fraud or sudden market crashes. However, it is a powerful baseline. It provides a quick, objective snapshot of a company’s financial health without getting lost in hundreds of pages of financial statements.
For us as engineers, the Z-Score is perfect because it is computational. It’s easy to write a Python script or an SQL query to calculate this daily for thousands of companies—exactly what we will look at in future engineering posts.